
The new version of EnergyHub offers our subscribers a resource focused on the global LNG industry.
EnergyHub offers detailed information on the world's LNG import and export infrastructure, with details on each facility's owners, history, capacity and future plans.
EnergyHub is more than just an LNG database, it places the plants and terminals within the context of the industry and the countries in which they are built. It provides more than just a 'when and where' approach, it looks to understand the wider issues acting on the industry.
Plant and terminal data
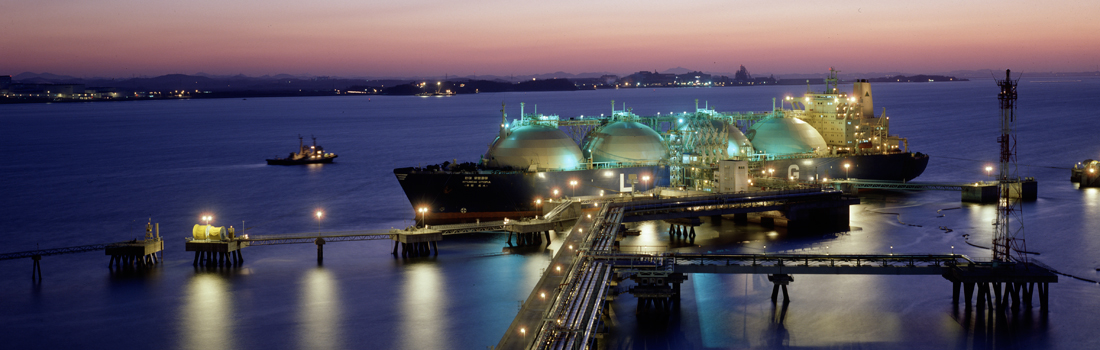
Each liquefaction plant and terminal has a profile which includes its start date, location, capacity and the companies acting as operators and stakeholders. The profiles detail the histories of the LNG facilities, recording when new trains came online and looking at future expansions and contractions in capacity.
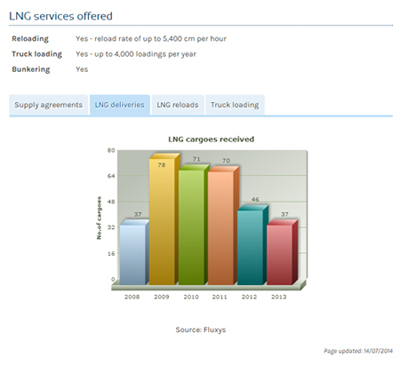
Profiles also include information on the growing number of services offered by LNG terminals – such as reloads, truck-loading, bunkering and cool-down services. Data on the use of these services are included where available. Information on capacity holders and offtake contracts is also displayed when they are made public.
Information on LNG infrastructure will be updated on a rolling basis as new plants come online and FIDs are taken.
Country context
Each country is introduced with an overview section that explains the situation of the LNG industry in that country and looks at the opportunities and challenges facing the industry.
Countries which are undergoing major regulatory or political changes have additional sections describing what the potential effects of these will be. Where appropriate, there is also a section on the companies based in that country, providing useful background information on the major players in the LNG industry.
Each country profile includes a statistics section drawn from a number of sources. Production, consumption, imports and exports of gas are displayed in graphs over a 10-year period, revealing trends – such as falling production or growing domestic consumption – that could lead to an increase in LNG imports or fall in exports. This insight is important to gain a thorough understanding of the industry. The graphs are interactive, allowing users to compare them against other countries.
Displayed alongside graphs of national production and consumption are pie charts showing the role of gas in power generation over 10 years. Gas for power is a major growth area and this data provides another insight into the sector. All statistics are accompanied by an explanation of the major trends apparent in the data.
Explore our database
Already have a subscription? Check out the available profiles from the drop-down menus in the navigation bar. Otherwise sign up for a free trial to Interfax Global Energy which includes full access to EnergyHub, Natural Gas Daily and Global Gas Analytics, contact the sales team at +44 (0)20 3004 6206, email [email protected] or register online for a free trial.